General Applications of Neural Networks
Session 7: Data Dashboards with Plotly Dash
Instructor: Wesley Beckner
Contact: wesleybeckner@gmail.com
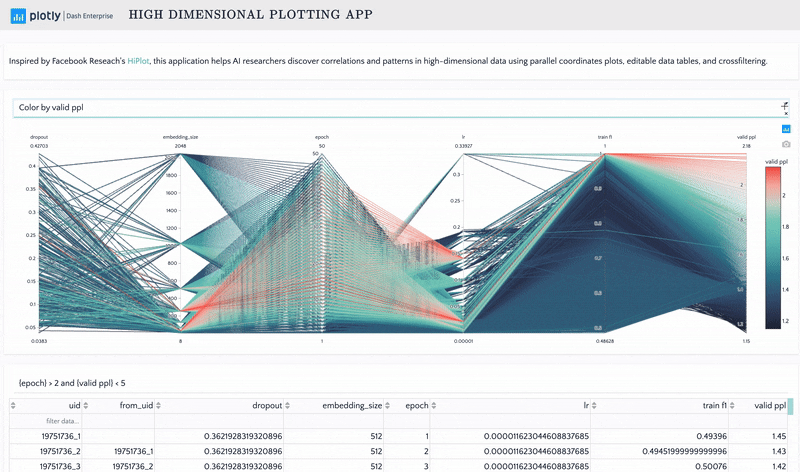
In this session we will turn our attention back to visualization! Specifically, we will use Plotly and Dash to put our visualizations into an interactive web format.
7.0 Preparing Environment and Importing Data
7.0.1 Import Packages
!pip install jupyter-dash

!pip install dash_daq
Collecting jupyter-dash
Downloading https://files.pythonhosted.org/packages/46/21/d3893ad0b7a7061115938d6c38f5862522d45c4199fb7e8fde0765781e13/jupyter_dash-0.4.0-py3-none-any.whl
Requirement already satisfied: ipython in /usr/local/lib/python3.7/dist-packages (from jupyter-dash) (5.5.0)
Requirement already satisfied: requests in /usr/local/lib/python3.7/dist-packages (from jupyter-dash) (2.23.0)
Requirement already satisfied: flask in /usr/local/lib/python3.7/dist-packages (from jupyter-dash) (1.1.4)
Collecting dash
[?25l Downloading https://files.pythonhosted.org/packages/d4/50/e7c2830168db186f84b7de2988543e974433a6cdb0a0b23d51c781e2b2ab/dash-1.20.0.tar.gz (77kB)
[K |████████████████████████████████| 81kB 3.6MB/s
[?25hRequirement already satisfied: retrying in /usr/local/lib/python3.7/dist-packages (from jupyter-dash) (1.3.3)
Requirement already satisfied: ipykernel in /usr/local/lib/python3.7/dist-packages (from jupyter-dash) (4.10.1)
Collecting ansi2html
Downloading https://files.pythonhosted.org/packages/c6/85/3a46be84afbb16b392a138cd396117f438c7b2e91d8dc327621d1ae1b5dc/ansi2html-1.6.0-py3-none-any.whl
Requirement already satisfied: setuptools>=18.5 in /usr/local/lib/python3.7/dist-packages (from ipython->jupyter-dash) (57.0.0)
Requirement already satisfied: simplegeneric>0.8 in /usr/local/lib/python3.7/dist-packages (from ipython->jupyter-dash) (0.8.1)
Requirement already satisfied: pygments in /usr/local/lib/python3.7/dist-packages (from ipython->jupyter-dash) (2.6.1)
Requirement already satisfied: decorator in /usr/local/lib/python3.7/dist-packages (from ipython->jupyter-dash) (4.4.2)
Requirement already satisfied: pickleshare in /usr/local/lib/python3.7/dist-packages (from ipython->jupyter-dash) (0.7.5)
Requirement already satisfied: pexpect; sys_platform != "win32" in /usr/local/lib/python3.7/dist-packages (from ipython->jupyter-dash) (4.8.0)
Requirement already satisfied: prompt-toolkit<2.0.0,>=1.0.4 in /usr/local/lib/python3.7/dist-packages (from ipython->jupyter-dash) (1.0.18)
Requirement already satisfied: traitlets>=4.2 in /usr/local/lib/python3.7/dist-packages (from ipython->jupyter-dash) (5.0.5)
Requirement already satisfied: idna<3,>=2.5 in /usr/local/lib/python3.7/dist-packages (from requests->jupyter-dash) (2.10)
Requirement already satisfied: certifi>=2017.4.17 in /usr/local/lib/python3.7/dist-packages (from requests->jupyter-dash) (2020.12.5)
Requirement already satisfied: chardet<4,>=3.0.2 in /usr/local/lib/python3.7/dist-packages (from requests->jupyter-dash) (3.0.4)
Requirement already satisfied: urllib3!=1.25.0,!=1.25.1,<1.26,>=1.21.1 in /usr/local/lib/python3.7/dist-packages (from requests->jupyter-dash) (1.24.3)
Requirement already satisfied: Jinja2<3.0,>=2.10.1 in /usr/local/lib/python3.7/dist-packages (from flask->jupyter-dash) (2.11.3)
Requirement already satisfied: itsdangerous<2.0,>=0.24 in /usr/local/lib/python3.7/dist-packages (from flask->jupyter-dash) (1.1.0)
Requirement already satisfied: click<8.0,>=5.1 in /usr/local/lib/python3.7/dist-packages (from flask->jupyter-dash) (7.1.2)
Requirement already satisfied: Werkzeug<2.0,>=0.15 in /usr/local/lib/python3.7/dist-packages (from flask->jupyter-dash) (1.0.1)
Collecting flask-compress
Downloading https://files.pythonhosted.org/packages/c6/d5/69b13600230d24310b98a52da561113fc01a5c17acf77152761eef3e50f1/Flask_Compress-1.9.0-py3-none-any.whl
Requirement already satisfied: plotly in /usr/local/lib/python3.7/dist-packages (from dash->jupyter-dash) (4.4.1)
Collecting dash_renderer==1.9.1
[?25l Downloading https://files.pythonhosted.org/packages/5f/d3/d661a68b4ce71498d5c0c79617bce3d5fc884d4448c698f77c2247cd1b46/dash_renderer-1.9.1.tar.gz (1.0MB)
[K |████████████████████████████████| 1.0MB 7.4MB/s
[?25hCollecting dash-core-components==1.16.0
[?25l Downloading https://files.pythonhosted.org/packages/f4/79/434e14d77dbf82b27f98df077936a424de254059d47152b0445b7116e97e/dash_core_components-1.16.0.tar.gz (3.5MB)
[K |████████████████████████████████| 3.5MB 13.2MB/s
[?25hCollecting dash-html-components==1.1.3
[?25l Downloading https://files.pythonhosted.org/packages/8f/ca/7eeca4cae4e15cc6f7d0bc41a46368dd3fcdddc72aaa5bac61a8b92d541c/dash_html_components-1.1.3.tar.gz (82kB)
[K |████████████████████████████████| 92kB 9.1MB/s
[?25hCollecting dash-table==4.11.3
[?25l Downloading https://files.pythonhosted.org/packages/97/f7/f4969a926f20a55d3e5970d01b85ff9ad510dba32de189e72dd8f4992740/dash_table-4.11.3.tar.gz (1.8MB)
[K |████████████████████████████████| 1.8MB 38.1MB/s
[?25hRequirement already satisfied: future in /usr/local/lib/python3.7/dist-packages (from dash->jupyter-dash) (0.16.0)
Requirement already satisfied: six>=1.7.0 in /usr/local/lib/python3.7/dist-packages (from retrying->jupyter-dash) (1.15.0)
Requirement already satisfied: jupyter-client in /usr/local/lib/python3.7/dist-packages (from ipykernel->jupyter-dash) (5.3.5)
Requirement already satisfied: tornado>=4.0 in /usr/local/lib/python3.7/dist-packages (from ipykernel->jupyter-dash) (5.1.1)
Requirement already satisfied: ptyprocess>=0.5 in /usr/local/lib/python3.7/dist-packages (from pexpect; sys_platform != "win32"->ipython->jupyter-dash) (0.7.0)
Requirement already satisfied: wcwidth in /usr/local/lib/python3.7/dist-packages (from prompt-toolkit<2.0.0,>=1.0.4->ipython->jupyter-dash) (0.2.5)
Requirement already satisfied: ipython-genutils in /usr/local/lib/python3.7/dist-packages (from traitlets>=4.2->ipython->jupyter-dash) (0.2.0)
Requirement already satisfied: MarkupSafe>=0.23 in /usr/local/lib/python3.7/dist-packages (from Jinja2<3.0,>=2.10.1->flask->jupyter-dash) (2.0.1)
Collecting brotli
[?25l Downloading https://files.pythonhosted.org/packages/15/ea/5bd575511b37bbd1c794606a0a621e6feff8e96b7dd007a86a5d218b2d94/Brotli-1.0.9-cp37-cp37m-manylinux1_x86_64.whl (357kB)
[K |████████████████████████████████| 358kB 34.7MB/s
[?25hRequirement already satisfied: pyzmq>=13 in /usr/local/lib/python3.7/dist-packages (from jupyter-client->ipykernel->jupyter-dash) (22.0.3)
Requirement already satisfied: jupyter-core>=4.6.0 in /usr/local/lib/python3.7/dist-packages (from jupyter-client->ipykernel->jupyter-dash) (4.7.1)
Requirement already satisfied: python-dateutil>=2.1 in /usr/local/lib/python3.7/dist-packages (from jupyter-client->ipykernel->jupyter-dash) (2.8.1)
Building wheels for collected packages: dash, dash-renderer, dash-core-components, dash-html-components, dash-table
Building wheel for dash (setup.py) ... [?25l[?25hdone
Created wheel for dash: filename=dash-1.20.0-cp37-none-any.whl size=85845 sha256=5e3c6abd8291a29081382e3dafb1d448842f0c0f24319c4550a9ab77cf398869
Stored in directory: /root/.cache/pip/wheels/e6/33/41/ce361d0d1da277d2350f815b10f2ab1e331592d93ef2b07e29
Building wheel for dash-renderer (setup.py) ... [?25l[?25hdone
Created wheel for dash-renderer: filename=dash_renderer-1.9.1-cp37-none-any.whl size=1014873 sha256=e8718c0db14919960665fa1499401a53694d379c2a4473dcc71a272029c0229f
Stored in directory: /root/.cache/pip/wheels/03/a9/c5/dd5815c601b0ede164c223ffd7bafebde716ca57de06ef8aec
Building wheel for dash-core-components (setup.py) ... [?25l[?25hdone
Created wheel for dash-core-components: filename=dash_core_components-1.16.0-cp37-none-any.whl size=3540992 sha256=d75a4ff62365b12450afcd2457d72eb2675bc2c5633af639000a4f8f1a1fa764
Stored in directory: /root/.cache/pip/wheels/86/1e/8c/e87ebba30b73c20dcd641224274febc983af88ed0fd7712a07
Building wheel for dash-html-components (setup.py) ... [?25l[?25hdone
Created wheel for dash-html-components: filename=dash_html_components-1.1.3-cp37-none-any.whl size=319488 sha256=8b940827400852cd5b9b16d3bd1e13d3d1e20f67218487d842c80a2b379d7071
Stored in directory: /root/.cache/pip/wheels/07/f9/6c/f9b73a6ae1b7f347a92dc240293cebc267b370ba2a80added2
Building wheel for dash-table (setup.py) ... [?25l[?25hdone
Created wheel for dash-table: filename=dash_table-4.11.3-cp37-none-any.whl size=1827623 sha256=1e5ce38d3d20c56f9a7f327e7cbdeea746976e593690fc71f1f5ec6575496021
Stored in directory: /root/.cache/pip/wheels/51/9b/89/374be1bc250e28a15edbd657cf364f163e392ba5257bfd0e87
Successfully built dash dash-renderer dash-core-components dash-html-components dash-table
Installing collected packages: brotli, flask-compress, dash-renderer, dash-core-components, dash-html-components, dash-table, dash, ansi2html, jupyter-dash
Successfully installed ansi2html-1.6.0 brotli-1.0.9 dash-1.20.0 dash-core-components-1.16.0 dash-html-components-1.1.3 dash-renderer-1.9.1 dash-table-4.11.3 flask-compress-1.9.0 jupyter-dash-0.4.0
Collecting dash_daq
[?25l Downloading https://files.pythonhosted.org/packages/16/c1/9c6adfc3646990965a5b2ca073f579cc9c09d15553fcfcd83aefd1255494/dash_daq-0.5.0.tar.gz (642kB)
[K |████████████████████████████████| 645kB 4.2MB/s
[?25hRequirement already satisfied: dash>=1.6.1 in /usr/local/lib/python3.7/dist-packages (from dash_daq) (1.20.0)
Requirement already satisfied: Flask>=1.0.4 in /usr/local/lib/python3.7/dist-packages (from dash>=1.6.1->dash_daq) (1.1.4)
Requirement already satisfied: dash-html-components==1.1.3 in /usr/local/lib/python3.7/dist-packages (from dash>=1.6.1->dash_daq) (1.1.3)
Requirement already satisfied: dash-table==4.11.3 in /usr/local/lib/python3.7/dist-packages (from dash>=1.6.1->dash_daq) (4.11.3)
Requirement already satisfied: flask-compress in /usr/local/lib/python3.7/dist-packages (from dash>=1.6.1->dash_daq) (1.9.0)
Requirement already satisfied: future in /usr/local/lib/python3.7/dist-packages (from dash>=1.6.1->dash_daq) (0.16.0)
Requirement already satisfied: plotly in /usr/local/lib/python3.7/dist-packages (from dash>=1.6.1->dash_daq) (4.4.1)
Requirement already satisfied: dash-core-components==1.16.0 in /usr/local/lib/python3.7/dist-packages (from dash>=1.6.1->dash_daq) (1.16.0)
Requirement already satisfied: dash-renderer==1.9.1 in /usr/local/lib/python3.7/dist-packages (from dash>=1.6.1->dash_daq) (1.9.1)
Requirement already satisfied: itsdangerous<2.0,>=0.24 in /usr/local/lib/python3.7/dist-packages (from Flask>=1.0.4->dash>=1.6.1->dash_daq) (1.1.0)
Requirement already satisfied: Werkzeug<2.0,>=0.15 in /usr/local/lib/python3.7/dist-packages (from Flask>=1.0.4->dash>=1.6.1->dash_daq) (1.0.1)
Requirement already satisfied: Jinja2<3.0,>=2.10.1 in /usr/local/lib/python3.7/dist-packages (from Flask>=1.0.4->dash>=1.6.1->dash_daq) (2.11.3)
Requirement already satisfied: click<8.0,>=5.1 in /usr/local/lib/python3.7/dist-packages (from Flask>=1.0.4->dash>=1.6.1->dash_daq) (7.1.2)
Requirement already satisfied: brotli in /usr/local/lib/python3.7/dist-packages (from flask-compress->dash>=1.6.1->dash_daq) (1.0.9)
Requirement already satisfied: retrying>=1.3.3 in /usr/local/lib/python3.7/dist-packages (from plotly->dash>=1.6.1->dash_daq) (1.3.3)
Requirement already satisfied: six in /usr/local/lib/python3.7/dist-packages (from plotly->dash>=1.6.1->dash_daq) (1.15.0)
Requirement already satisfied: MarkupSafe>=0.23 in /usr/local/lib/python3.7/dist-packages (from Jinja2<3.0,>=2.10.1->Flask>=1.0.4->dash>=1.6.1->dash_daq) (2.0.1)
Building wheels for collected packages: dash-daq
Building wheel for dash-daq (setup.py) ... [?25l[?25hdone
Created wheel for dash-daq: filename=dash_daq-0.5.0-cp37-none-any.whl size=669715 sha256=adea8b7fc20afaee7842ce0128ed6b5cffa018c96303aa7898e371cb19626499
Stored in directory: /root/.cache/pip/wheels/1c/9c/f7/84731716eaa9fc952cdbdd1f87df3ca9b8805c317c609efcd6
Successfully built dash-daq
Installing collected packages: dash-daq
Successfully installed dash-daq-0.5.0
import pandas as pd
import numpy as np
import plotly.express as px
from jupyter_dash import JupyterDash
import dash_core_components as dcc
import dash_html_components as html
import dash_daq as daq

from dash.dependencies import Input, Output
import plotly.graph_objects as go
import plotly.express as px
from itertools import cycle
7.0.2 Load Dataset
margin = pd.read_csv("https://raw.githubusercontent.com/wesleybeckner/ds_for_engineers/main/data/truffle_margin/truffle_margin_customer.csv")
margin.head()
| Base Cake | Truffle Type | Primary Flavor | Secondary Flavor | Color Group | Customer | Date | KG | EBITDA/KG | |
|---|---|---|---|---|---|---|---|---|---|
| 0 | Butter | Candy Outer | Butter Pecan | Toffee | Taupe | Slugworth | 1/2020 | 53770.342593 | 0.500424 |
| 1 | Butter | Candy Outer | Ginger Lime | Banana | Amethyst | Slugworth | 1/2020 | 466477.578125 | 0.220395 |
| 2 | Butter | Candy Outer | Ginger Lime | Banana | Burgundy | Perk-a-Cola | 1/2020 | 80801.728070 | 0.171014 |
| 3 | Butter | Candy Outer | Ginger Lime | Banana | White | Fickelgruber | 1/2020 | 18046.111111 | 0.233025 |
| 4 | Butter | Candy Outer | Ginger Lime | Rum | Amethyst | Fickelgruber | 1/2020 | 19147.454268 | 0.480689 |
7.1 Layout
7.1.1 app.layout
The simplest dash app needs a layout to be set. This will store all the juicy bits that orient our plot objects (think kind of like what the fig was in fig, ax with pyplot!)
We start by importing our core library and components libraries (more on this in a moment)
from jupyter_dash import JupyterDash
import dash_core_components as dcc
import dash_html_components as html
app = JupyterDash() # when using ahem, real dash, this will be
# app = Dash()

app.layout = html.Div(["Hello World!"])

app.run_server(mode='inline')
<IPython.core.display.Javascript object>
let's talk a little bit now about where that html.Div came from
7.1.2 components
html is just one of two component libraries we use with Dash, dash_html_components (html) and dash_core_components (dcc). With the components libraries you can build the look and feel of your app - you can also create your own custom components using Javascript and React Js.
7.1.2.1 dash_html_components (html)
dash_html_components contains all the html components of dash, just like the html components you'd recognize in an html frame work (H1, H2, Div, P, etc.)
7.1.2.2 dash_core_components (dcc)
In order to create a graph in our dash layout, we use the Graph class from dash_core_components. Graph renders visualizations from plotly (because of this, we can prototype our visualization in plotly before incorporating them into a dashboard! We need to supply both a data and a layout to Graph.
We can change stylings like the background and text colors with Dash. Visit the documentation for the components to get the full list of styling options. the style property is a little different than that of pure HTML. The style dictionary is camelCased (e.g. textAlign vs text-align)
In the following we dictate the children of each component explicitly. This can be thought of as the content of the component:
app = JupyterDash()

app.layout = html.Div(style={'backgroundColor': '#111111'},
                      children=
                html.H1(style={'color': '#ffffff'}, children=["Hello World!"]),
                      )

app.run_server(mode='inline')
<IPython.core.display.Javascript object>
But we can also declare the children implicitly:
# can also be written this way
app = JupyterDash()

app.layout =  html.Div(
                html.H1(["Hello World!"],
                style={'color': '#ffffff'}),
              style={'backgroundColor': '#111111'})

app.run_server(mode='inline')
<IPython.core.display.Javascript object>
If we have multiple children in a component, like the outer Div() wrapper here: we just have to remember to put them in a list:
app = JupyterDash()

colors = {'background': '#111111',
          'text': '#ffffff'}

app.layout =  html.Div([
                html.H1(["Hello World!"
                  ],
                  style={'color': colors['text']}
                  ),
                dcc.Graph(
                  id='Graph1',
                  figure={
                      'data': [
                          {'x': [1, 2, 3], 'y': [4, 1, 2], 'type': 'bar', 'name': 'SF'},
                          {'x': [1, 2, 3], 'y': [2, 4, 5], 'type': 'bar', 'name': u'Montréal'},
                              ],
                      'layout': {
                          'plot_bgcolor': colors['background'],
                          'paper_bgcolor': colors['background'],
                          'font': {
                              'color': colors['text']
                              }
                          }
                      }
                  ),
                ],
                style={'backgroundColor': colors['background']}
                )

app.run_server(mode='external')
Dash app running on:


<IPython.core.display.Javascript object>
We could've declared that graph object with plotly express. This can often be easier while still getting the figure we desire.
the df we've created here is an example of tidy data
df = pd.DataFrame({
    "Fruit": ["Apples", "Oranges", "Bananas", "Apples", "Oranges", "Bananas"],
    "Amount": [4, 1, 2, 2, 4, 5],
    "City": ["SF", "SF", "SF", "Montreal", "Montreal", "Montreal"]
})

fig = px.bar(df, x="Fruit", y="Amount", color="City", barmode="group")
After creating the figure in plotly express, we can just include it in the layout:
app = JupyterDash()

colors = {'background': '#ffffff',
          'text': '#111111'}

app.layout =  html.Div([
                html.H1(["Hello World!"
                  ],
                  style={'color': colors['text']}
                  ),
                dcc.Graph(
                  id='Graph1',
                  figure=fig,
                  ),
                ],
                style={'backgroundColor': colors['background']}
                )

app.run_server(mode='inline')
<IPython.core.display.Javascript object>
Last note on children: The children property is special. By convention, it's always the first attribute which is why we could ommit it: html.H1(children='Hello World!') is the same as html.H1('Hello World!'). Also, it can contain a string, a number, a single component, or a list of components.
🏋️ Exercise 1: Create your first Dashboard!!!
Visit the documentation for plotly scatter plots. Create a scatter plot using plotly.express and embed it in a dashboard.
app = JupyterDash()

colors = {'background': '#ffffff',
          'text': '#111111'}

app.layout =  html.Div([
                html.H1(["Hello World!" # YOUR TITLE HERE
                  ],
                  style={'color': colors['text']}
                  ),
                dcc.Graph(
                  id='Graph1',
                  figure=fig, # YOUR FIGURE HERE
                  ),
                ],
                style={'backgroundColor': colors['background']}
                )

app.run_server(mode='inline')
And you can use the following X and y data:
from sklearn.datasets import make_blobs
X, y = make_blobs(random_state=42, centers=4, cluster_std=2.5)

# X has 2 dims (for axis 1 and axis 2)
# y is a binary that can be used to color the scatter points
And here I've created a shell for you to work with
# the scatter plot
fig = px.scatter(
    ### YOUR CODE HERE ###

      )
# updating fig attributes
fig.update_layout(
  autosize=False,
  width=800,
  height=500,
  title='A Smattering of Points'
  )
app = JupyterDash()

colors = {'background': '#ffffff',
          'text': '#111111'}

app.layout =  html.Div([
                html.H1(["LOOK AT ALL THOSE CHICKENS!" # YOUR TITLE HERE
                  ],
                  style={'color': colors['text']}
                  ),
                dcc.Graph(
                  id='Graph1',
                  figure=fig, # YOUR FIGURE HERE
                  ),
                ],
                style={'backgroundColor': colors['background']}
                )

app.run_server(mode='inline')
<IPython.core.display.Javascript object>
7.1.3 Style Sheets
You can leverage pre-existing style sheets to stylize your components and layout. We'll do that in the next example with reusable components.
7.1.4 Reusable Components
We can create reusable components for ourselves without switching contexts or languages. For example, defining a single figure that is reused throughout the app with different parameters. Or a table:
def generate_table(dataframe, max_rows=10):
    return html.Table([
        html.Thead(
            html.Tr([html.Th(col) for col in dataframe.columns])
        ),
        html.Tbody([
            html.Tr([
                html.Td(dataframe.iloc[i][col]) for col in dataframe.columns
            ]) for i in range(min(len(dataframe), max_rows))
        ])
    ])

external_stylesheets = ['https://codepen.io/chriddyp/pen/bWLwgP.css']

app = JupyterDash(external_stylesheets=external_stylesheets)

app.layout = html.Div(children=[
    html.H4(children='Our Fruit Data'),
    generate_table(df)
])

app.run_server(mode='inline')
<IPython.core.display.Javascript object>
As a side note, it is also easy to just include dash_table from dash to create a ready-to-go table:
import dash_table

app = JupyterDash(external_stylesheets=external_stylesheets)

app.layout = html.Div(children=[
    html.H4(children='Our Fruit Data'),
    dash_table.DataTable(
                        id='table',
                        columns=[{"name": i, "id": i} for i in df.columns],
                        data=df.to_dict('records'),
                        page_size=20,
                        style_table={'maxWidth': '100%',
                                     'overflowX': 'auto'}
                        )
])

app.run_server(mode='inline')
<IPython.core.display.Javascript object>
7.1.5 Markdown
You can also use markdown with dash.
app = JupyterDash(external_stylesheets=external_stylesheets)

markdown_text = '''
### Dash and Markdown

Dash apps can be written in Markdown.
Dash uses the [CommonMark](http://commonmark.org/)
specification of Markdown.
Check out their [60 Second Markdown Tutorial](http://commonmark.org/help/)
if this is your first introduction to Markdown!
'''

app.layout = html.Div([
    dcc.Markdown(children=markdown_text)
])

app.run_server('inline')
<IPython.core.display.Javascript object>
🏋️ Exercise 2: Play with Markdown
In the following cell play with markdown. Include 2 different headers, a paragraph, a displayed image, a bulleted list and a numbered list. If you have extra time include a table.
# Code cell for exercise 5.1.5.1

app = JupyterDash(external_stylesheets=external_stylesheets)


### YOUR CODE DOWN BELOW ###
markdown_text = '''

'''

app.layout = html.Div([
    dcc.Markdown(children=markdown_text)
])

app.run_server('inline')
<IPython.core.display.Javascript object>
7.1.6 More on dash_core_components
dash_core_complonents contains all your dashboard goodies: dropdown menus, sliders, range bars, radio buttons, etc.
external_stylesheets = ['https://codepen.io/chriddyp/pen/bWLwgP.css']

app = JupyterDash(__name__, external_stylesheets=external_stylesheets)

app.layout = html.Div([
    html.Label('Dropdown'),
    dcc.Dropdown(
        options=[
            {'label': 'New York City', 'value': 'NYC'},
            {'label': u'Montréal', 'value': 'MTL'},
            {'label': 'San Francisco', 'value': 'SF'}
        ],
        value='MTL'
    ),

    html.Label('Multi-Select Dropdown'),
    dcc.Dropdown(
        options=[
            {'label': 'New York City', 'value': 'NYC'},
            {'label': u'Montréal', 'value': 'MTL'},
            {'label': 'San Francisco', 'value': 'SF'}
        ],
        value=['MTL', 'SF'],
        multi=True
    ),

    html.Label('Radio Items'),
    dcc.RadioItems(
        options=[
            {'label': 'New York City', 'value': 'NYC'},
            {'label': u'Montréal', 'value': 'MTL'},
            {'label': 'San Francisco', 'value': 'SF'}
        ],
        value='MTL'
    ),

    html.Label('Checkboxes'),
    dcc.Checklist(
        options=[
            {'label': 'New York City', 'value': 'NYC'},
            {'label': u'Montréal', 'value': 'MTL'},
            {'label': 'San Francisco', 'value': 'SF'}
        ],
        value=['MTL', 'SF']
    ),

    html.Label('Text Input'),
    dcc.Input(value='MTL', type='text'),

    html.Label('Slider'),
    dcc.Slider(
        min=0,
        max=9,
        marks={i: 'Label {}'.format(i) if i == 1 else str(i) for i in range(1, 6)},
        value=5,
    ),
], style={'columnCount': 2})

app.run_server('inline')
<IPython.core.display.Javascript object>
7.2 Basic Callbacks
Now we'll talk about how to make our Dash apps interactive (hey, that's what all the dcc components are for anyways!). To do this, we'll write callback functions, that are executed whenever a component on the app is updated. We do this with the @app decorator.
7.2.1 Simple Interactive Dash App
To make our apps interactive we'll import two new functions Input and Output from dash.dependencies
from dash.dependencies import Input, Output
app = JupyterDash()

app.layout = html.Div([
    dcc.Input(id='my-id', value='Dash App', type='text'),
    html.Div(id='my-div')
])


@app.callback(
    Output(component_id='my-div', component_property='children'),
    [Input(component_id='my-id', component_property='value'),]
)
def update_output_div(input_value):
    return 'You\'ve entered "{}"'.format(input_value)

app.run_server('inline')
<IPython.core.display.Javascript object>
7.2.2 Multiple Inputs
You can have multiple inputs to a callback:
@app.callback(
    Output('indicator-graphic', 'figure'),
    [Input('xaxis-column', 'value'),
    Input('yaxis-column', 'value'),
    Input('xaxis-type', 'value'),
    Input('yaxis-type', 'value'),
    Input('year--slider', 'value')]
)
7.2.3 Multiple Outputs
As well as multiple outputs:
@app.callback(
    [Output('square', 'children'),
    Output('cube', 'children'),
    Output('twos', 'children'),
    Output('threes', 'children'),
    Output('x^x', 'children'),],
    Input('num-multi', 'value'))
Let's put the multiple inputs thing together:
app = JupyterDash()

app.layout = html.Div([
    dcc.Input(id='my-id', value='Green', type='text'),
    html.Div(id='my-div'),

    ### HERES MY NEW COMPONENT
    dcc.Dropdown(id='drop-id',
        options=[
            {'label': 'Dipsy', 'value': 'Dipsy'},
            {'label': 'Po', 'value': 'Po'},
            {'label': 'LaLa', 'value': 'LaLa'}
        ],
        value='Dipsy',
        style={'width': '300px'}
    ),
])


@app.callback(
    Output(component_id='my-div', component_property='children'),
    [Input(component_id='my-id', component_property='value'),
     Input(component_id='drop-id', component_property='value'),] # HERS MY NEW INPUT
)
def update_output_div(input_value, value2): # MY NEW VAR
    return "{} is {}".format(value2, input_value)

app.run_server('inline')
<IPython.core.display.Javascript object>
🏋️ Exercise 3: Changing Graph Elements with Callbacks and Dash Core Components
Take the plot you made in exercise 5.1.2.3 and this time use one of the dcc components to toggle on/off the different classes of data on the plot!
You will need:
- a new component on your layout that allows the user to select the classes of data to display. I did this with a checklist, but you can choose something else if you want! Note that by setting
value=[0,1,2,3]all the values are selected on load:
html.Label('Checkboxes'),
dcc.Checklist(id='check-1', # A NEW CHECKLIST TO SELECT CLASSES
    options=[
        {'label': 'Green', 'value': 0},
        {'label': 'Purple', 'value': 1},
        {'label': 'Red', 'value': 2},
        {'label': 'Blue', 'value': 3}
    ],
    value=[0, 1, 2, 3]
    ),
- a function
my_figthat properly selects the data before plotting. You can use this code to help you get started (I like to think in dataframes and that's also what we've used most frequently in these classes, but it could also be done with lower level objects like numpy arrays:
values = [0, 1, 2, 3] # a list that represents the selected classes
df = pd.DataFrame(np.concatenate((X,(np.array(y).reshape(-1,1))), axis=1))
  df = df.loc[df[2].isin(values)] # column 2 is the y values
  Xfilt = df[[0,1]].values # set the new X
  yfilt = df[2].values # set the new y
- a callback that sends the metadata for what classes have been selected by the user
@app.callback(
    Output(component_id='<YOUR FIG ID>', component_property='figure'),
    [Input(component_id='<YOUR COMPONENT ID>', component_property='value')]
)
def update_output_div(groups):
    return my_fig(groups)
colors = {'background': '#ffffff',
          'text': '#111111'}

external_stylesheets = ['https://codepen.io/chriddyp/pen/bWLwgP.css']


def my_fig(values=[0,1,2,3]): # input parameter for the 4 different groups of data

  ### YOUR CODE THAT PARSES AND SELECTS THE RIGHT DATA ###

  fig = px.scatter(x=X[:,0], y=X[:,1], color=y.astype(str))

  fig.update_layout(
    autosize=False,
    width=800,
    height=500,
    )
  return fig

### BEGIN APP ###
app = JupyterDash(__name__, external_stylesheets=external_stylesheets)

app.layout =  html.Div([
                html.H1(["LOOK AT ALL THOSE CHICKENS!" # YOUR TITLE HERE
                    ],
                    style={'color': colors['text']}
                    ),
                    ### YOUR COMPONENT THAT ALLOWS THE USER TO SELECT DATA CLASSES

                dcc.Graph(
                    id='fig-1',
                    figure=my_fig(), # YOUR FIGURE HERE
                    ),
                html.P(id='test'), # A DUMMY ELEMENT TO VIEW TEST DATA
                ],
                style={'backgroundColor': colors['background']}
                )

### YOUR CALLBACK TO CHANGE YOUR FIGURE HERE


### A DUMMY CALLBACK TO HELP YOU TEST OUT SELECTIONS FROM check-1
### UNCOMMENT THIS AFTER YOUVE CREATED A COMPONENT WITH THE ID check-1
### THEN YOU CAN SEE WHAT DATA IS BEING SENT AROUND BY SENDING IT TO
### THE CHILDREN OF TEST

# @app.callback(
#     Output(component_id='test', component_property='children'),
#     [Input(component_id='check-1', component_property='value')]
# )
# def update_output_div(groups):
#     return groups

app.run_server(mode='inline')
<IPython.core.display.Javascript object>
🍒 Enrichment: Chained Callbacks
Chained callbacks are worth a nod. We won't go into detail here, but the basic idea and thing to note is that, if you have an interactive element on your page that is dependent on some other interactive element (for instance a radio button series of cities that is dependent on a dropdown menu of states) you can make one callback dependent on another simply by making the input of the dependent element the output of the independent element. Like so:
# this callback will fire

@app.callback(
    Output('cities-radio', 'options'), # <--- cities-radio is an output
    Input('states-radio', 'value'))
def set_cities_options(selected_state):
    return [{'label': i, 'value': i} for i in all_options[selected_state]]


# and then this callback will fire

@app.callback(
    Output('cities-radio', 'value'),
    Input('cities-radio', 'options')) # <--- cities-radio is an input
def set_cities_value(available_options):
    return available_options[0]['value']
7.3 Interactive Graphing and Crossfiltering
There are four different types of data generated when the user interacts with the plot using their mouse: hover, click, select, and zoom data.
import json

import dash
import dash_core_components as dcc
import dash_html_components as html
from dash.dependencies import Input, Output
import plotly.express as px
import pandas as pd

external_stylesheets = ['https://codepen.io/chriddyp/pen/bWLwgP.css']

app = JupyterDash(__name__, external_stylesheets=external_stylesheets)

styles = {
    'pre': {
        'border': 'thin lightgrey solid',
        'overflowX': 'scroll'
    }
}

df = pd.DataFrame({
    "x": [1,2,1,2],
    "y": [1,2,3,4],
    "customdata": [1,2,3,4],
    "fruit": ["apple", "apple", "orange", "orange"]
})

fig = px.scatter(df, x="x", y="y", color="fruit", custom_data=["customdata"])

fig.update_layout(clickmode='event+select')

fig.update_traces(marker_size=20)

app.layout = html.Div([
    dcc.Graph(
        id='basic-interactions',
        figure=fig
    ),

    html.Div(className='row', children=[
        html.Div([
            dcc.Markdown("""
                **Hover Data**

                Mouse over values in the graph.
            """),
            html.Pre(id='hover-data', style=styles['pre'])
        ], className='three columns'),

        html.Div([
            dcc.Markdown("""
                **Click Data**

                Click on points in the graph.
            """),
            html.Pre(id='click-data', style=styles['pre']),
        ], className='three columns'),

        html.Div([
            dcc.Markdown("""
                **Selection Data**

                Choose the lasso or rectangle tool in the graph's menu
                bar and then select points in the graph.

                Note that if `layout.clickmode = 'event+select'`, selection data also
                accumulates (or un-accumulates) selected data if you hold down the shift
                button while clicking.
            """),
            html.Pre(id='selected-data', style=styles['pre']),
        ], className='three columns'),

        html.Div([
            dcc.Markdown("""
                **Zoom and Relayout Data**

                Click and drag on the graph to zoom or click on the zoom
                buttons in the graph's menu bar.
                Clicking on legend items will also fire
                this event.
            """),
            html.Pre(id='relayout-data', style=styles['pre']),
        ], className='three columns')
    ])
])


@app.callback(
    Output('hover-data', 'children'),
    Input('basic-interactions', 'hoverData'))
def display_hover_data(hoverData):
    return json.dumps(hoverData, indent=2)


@app.callback(
    Output('click-data', 'children'),
    Input('basic-interactions', 'clickData'))
def display_click_data(clickData):
    return json.dumps(clickData, indent=2)


@app.callback(
    Output('selected-data', 'children'),
    Input('basic-interactions', 'selectedData'))
def display_selected_data(selectedData):
    return json.dumps(selectedData, indent=2)


@app.callback(
    Output('relayout-data', 'children'),
    Input('basic-interactions', 'relayoutData'))
def display_relayout_data(relayoutData):
    return json.dumps(relayoutData, indent=2)

app.run_server('inline')
🏋️ Exercise 4: Interactive Filtering to Display Aggregate Stats
Use Selection Data in your plot from exercise 5.2.4 to display the $\bar y$ and $\bar x$ value of the selected data somewhere in your layout.
Here's some starter code for handling selectedData:
@app.callback(
    Output('<SOME DIV ID>', 'children'),
    Input('<YOUR FIGURE>', 'selectedData'))
def display_selected_data(selectedData):
    if selectedData: # if to avoid error mssg when None
      sel = pd.DataFrame(selectedData["points"])
      ### YOUR CODE ###

      <RETURN> <SOMETHING>
Hint: to figure out what the object
selcontains, sendsel.to_jsonto the children oftest, the html.P at the bottom of the layout. You can then copy and paste that into a cell in the notebook to parse by hand (after converting it back into a dataframe) so that you get the formula right
colors = {'background': '#ffffff',
          'text': '#111111'}

external_stylesheets = ['https://codepen.io/chriddyp/pen/bWLwgP.css']


### YOUR FUNCTION FROM my_fig FROM 5.2.4 ###
def my_fig():

  fig = px.scatter(x=X[:,0], y=X[:,1], color=y.astype(str))

  fig.update_layout(
    autosize=False,
    width=800,
    height=500,

    )
  return fig

app = JupyterDash(__name__, external_stylesheets=external_stylesheets)

app.layout =  html.Div([
                html.H1(["LOOK AT ALL THOSE CHICKENS!" # YOUR TITLE HERE
                    ],
                    style={'color': colors['text']}
                    ),


                    ### YOUR SELECTION DIV FROM 5.2.4 (dcc.checklist)

                dcc.Graph(
                    id='fig-1',
                    figure=my_fig(), # YOUR FIGURE HERE
                    ),
                html.P(id='test'),
                ],
                style={'backgroundColor': colors['background']}
                )

### YOUR CALLBACK FROM 5.2.4 FOR UPDATING THE FIG ###

@app.callback(
    Output('test', 'children'),
    Input('fig-1', 'selectedData'))
def display_selected_data(selectedData):
    if selectedData:
      sel = pd.DataFrame(selectedData["points"])
      return sel.to_json()

app.run_server(mode='external')
Dash app running on:


<IPython.core.display.Javascript object>